Call Trace
From the Call Trace page of the SBS Console, you can perform the following actions:
- View the number of queries or mutations that were run for each SBS service, within a custom date range that you specify.
- Filter, search, and sort call traces.
You can filter call traces by the following criteria:
- by the name of the service
- by the application where the call took place
- by the tenant where the call took place
- by a date range when the call took place
- by the outcome of the call (data or error)
Access
You can access the Call Trace page as follows:
- Sign in to the SBS Console.
- Select an account.
- Click Call Trace in the left-hand side menu.
To query call traces, you can use either the Web UI or a GraphQL interface. You can switch at any time between the two interfaces by clicking the switch displayed at the top of the page:

If you are not the SBS root user of the account, all the actions available to you in the SBS Console are based on the permissions assigned to you by the root user. This applies both to the Web UI and the GraphQL interface.
View call traces
To view call traces for a specific SBS service:
- Select a service from the drop-down list in the upper area of the page.
- Optionally, select the application. Note that this filter is available only if the selected service supports filtering by application.
- Optionally, select the tenant. Note that this filter is available only if the selected service supports filtering by tenant.
- Optionally, set a date range. The default date range is the current month (from the 1st of the current month up to and including today).
- Optionally, filter data by the outcome of the call (data or error), by selecting the appropriate value from the drop-down list. The default value is “Any result”.
- Click View.
Depending on your screen resolution, you may need to click the Filter  button to display all available filters.
button to display all available filters.
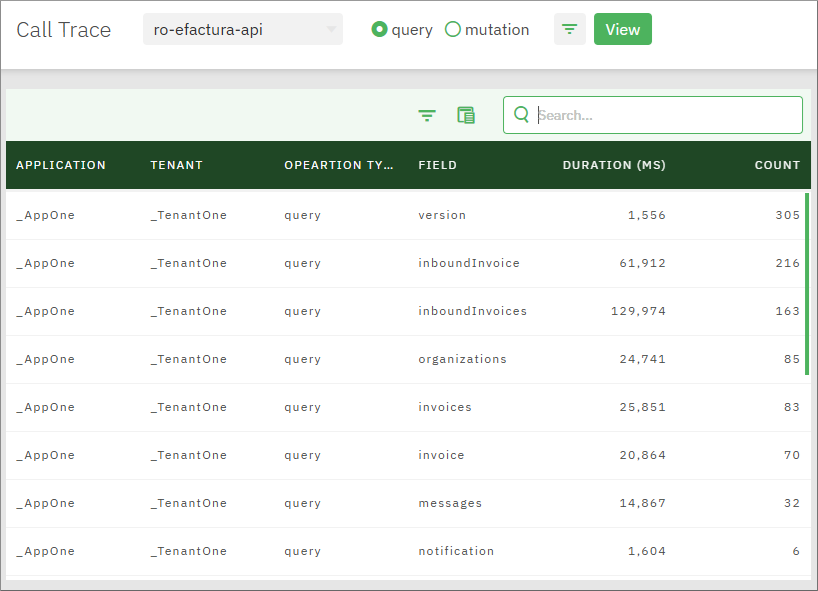
The available grid columns are as follows:
| Column | Purpose |
|---|---|
| Application | Indicates the name of the application where calls matching the filter criteria took place. This column is populated only if the selected service is accessible at application level. For example, if the selected service is account-api, this column is not meaningful, so it is empty. |
| Tenant | Indicates the name of the tenant where calls matching the filter criteria took place. This column is populated only if the selected service is accessible at tenant level. For example, if the selected service is account-api, this column is not meaningful, so it is empty. |
| Operation type | Indicates the type of GraphQL operation. Can be query or mutation. |
| Field | The name of the GraphQL query or mutation that was run. |
| Duration (ms) | The aggregated duration of all calls that match the filter criteria, in milliseconds. |
| Count | The count of calls matching the filter criteria. |