Call Trace UI
The Call Trace page of the SBS portal holds two views. The Call Trace view reports the API calls that took place for your tenant, and the Webhook Trace view reports the webhook deliveries that SBS attempted for your tenant. A webhook is an automation setting that enables SBS to notify an external application or service about an event that took place in SBS. For information about setting up a webhook, see Webhooks.
From the Call Trace view, you can perform the following actions:
- View the number of queries or mutations that were run for each SBS service, within a custom date range that you specify.
- Filter, search, and sort call tracing statistics. For example, you can filter call traces by a date range, by the outcome of the call (data or error), or by the name of the applicable service.
From the Webhook Trace view, you can perform the following actions:
- View each webhook delivery that SBS attempted, including the event that triggered it, the HTTP status that your endpoint returned, and the duration of the delivery.
- Filter deliveries by a date range, by service, by event, or by the outcome of the delivery.
Access
You can access the Call Trace page of the portal as follows:
- Sign in to the SBS Portal. During the sign-in process, you will be prompted to select the account, app, and tenant where you are entitled to sign in.
- Click Call Trace in the left-hand side menu.
The page opens on the Call Trace view. To move between the two views, click Call Trace or Webhook Trace at the top of the page:

To interact with the Call Trace service, you can use either the Web UI or a GraphQL interface. You can switch at any time between the two interfaces by clicking the switch displayed at the top of the page:

A single permission governs both views: if you can open the Call Trace page, you can use the Call Trace view and the Webhook Trace view.
View call traces
To view call traces for a specific SBS service:
-
Select a service from the drop-down list in the upper area of the page.
-
Optionally, adjust the date range. The default date range is the current month (from the 1st of the current month up to and including today).
-
Optionally, filter data by the outcome of the call (data or error), by selecting the appropriate value from the drop-down list. The default value is “Any result”.

-
Click View.
The results are displayed in two grids. The “Calls” (upper) grid displays the count of calls of the same type. For example, if multiple distinctCalls queries occurred within the selected date range, the grid contains a row for this query, indicating the count of such calls and their cumulative duration in milliseconds.
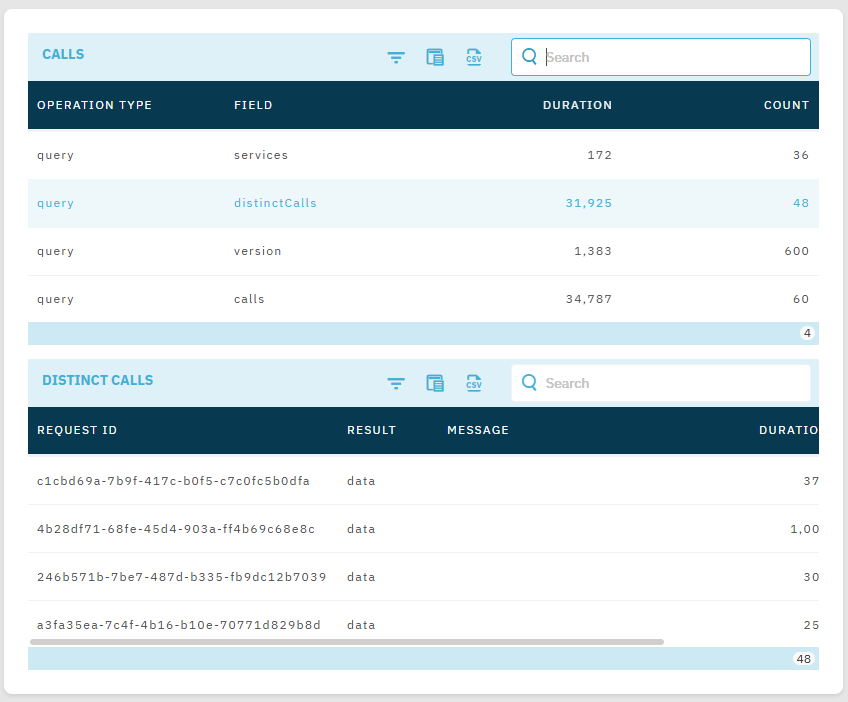
The available grid columns in the upper grid are as follows:
| Column | Purpose |
|---|---|
| Operation type | Indicates the type of GraphQL operation. Can be query or mutation. |
| Field | The name of the GraphQL query or mutation. |
| Duration | The aggregated duration of all calls of this type within the selected date range, in milliseconds |
| Count | The count of calls of this type, within the selected date range. |
The “Distinct calls” (lower) grid enables you to drill down into details for any of the call groups displayed in the upper grid. To populate the “Distinct calls” grid with data, click a row in the “Calls” grid. The available grid columns are as follows:
| Column | Purpose |
|---|---|
| Request ID | The unique request ID of the call across the entire API. |
| Result | The result of the call. Valid values: data - the call produced data, error - the call resulted in an error. |
| Message | The error message associated with this request ID, if applicable. |
| Source IP | The IP address of the API caller. |
| Duration | The duration of the call, in milliseconds |
| Created at | The date and time when the call occurred. |
View webhook traces
To view the webhook deliveries that SBS attempted for your tenant:
-
Click Webhook Trace at the top of the page.
-
Select a From date. This filter is mandatory, and the View button remains unavailable until you set it.
-
Optionally, set a To date, and any of the Service, Event, Webhook type, and Result filters.

-
Click View.
The available filters are as follows:
| Filter | Purpose |
|---|---|
| From | Mandatory. The date starting with which deliveries are listed. |
| To | Optional. The date up to which deliveries are listed. If you leave it empty, deliveries up to the present are listed. |
| Service | Optional. Lists only the deliveries raised by the service that you select. |
| Event | Optional. The event that triggered the delivery, for example, EMAIL_DELIVERED. To find the events that a service raises, see the Webhooks section of the reference page of that service. |
| Webhook type | Optional. Not currently used. |
| Result | Optional. Success or Error. The default value is “Any result”. |
The filters combine, so a delivery is listed only if it matches every filter that you set. If you change a filter after running a query, the results are cleared; click View again to run the query with the new filter. If no delivery matches, the page reports that there are no webhook calls for the selected filters.
On narrower screens, only the From and To filters remain on the filter bar. Click the filter icon to open a dialog that holds all six filters.
The deliveries are listed newest first, and failed deliveries are highlighted:
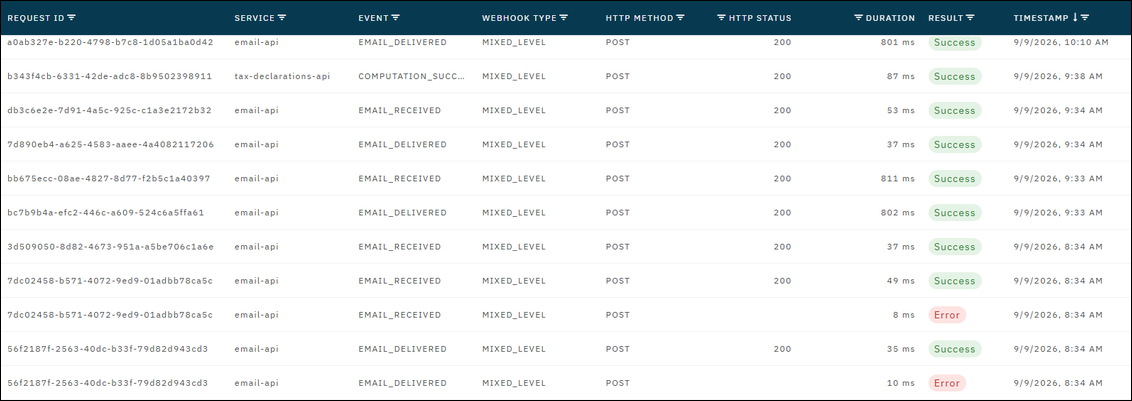
The available grid columns are as follows:
| Column | Purpose |
|---|---|
| Request ID | The unique identifier of the delivery. Quote this value when you report a delivery problem to support. |
| Service | The SBS service that raised the webhook. |
| Event | The event that triggered the delivery. |
| Webhook type | Not currently used. |
| HTTP method | The HTTP method with which SBS posted to your endpoint. |
| HTTP status | The HTTP status code that your endpoint returned. This column is empty if the delivery never reached your endpoint. |
| Duration | The duration of the delivery, in milliseconds. |
| Result | The outcome of the delivery. Valid values: Success, Error. |
| Timestamp | The date and time when the delivery took place. |