Predictive Inventory Management UI
From the Predictive Inventory Management page of the SBS portal, you can perform the following actions:
- Compute replenishment proposals and track their current status
- View all replenishment proposals for the currently selected account, application, tenant, and organization
- For each proposal, you can view its input and output files, and processes
- Filter, search and sort replenishment proposals.
Access
You can access the Predictive Inventory Management page of the portal as follows:
- Sign in to the SBS Portal. During the sign-in process, you will be prompted to select the account, app, and tenant where you are entitled to sign in.
- Click Predictive Inventory Management in the left hand-side menu.
- If applicable, select the organization from the drop-down list at the top of the page.
To interact with the Predictive Inventory Management service, you can use either the Web UI or a GraphQL interface. You can switch at any time between the two interfaces by clicking the switch displayed at the top of the page:

View replenishment proposals
After you access the Predictive Inventory Management UI, the replenishment proposals stored in SBS for the selected account, application, and tenant are displayed in the upper grid. To view details about a particular replenishment proposal, click the respective row in the grid. This loads all processes and files of that proposal in the lower grid, for example:
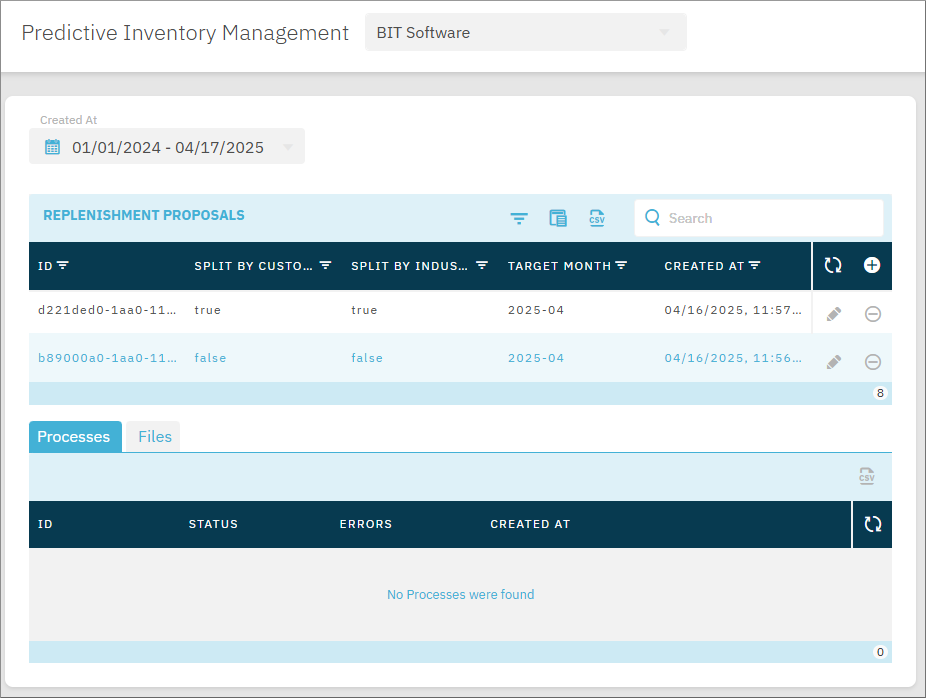
Replenishment proposal structure
The table below shows the replenishment proposal fields.
| Field | Description |
|---|---|
| ID | The unique identifier of the replenishment proposal in SBS. |
| Split by customer | If true, indicates that the proposal was created with the option to split results by customer ID. |
| Split by industry | If true, indicates that the proposal was created with the option to split results by industry code ID. |
| Target month | The month for which the replenishment proposal was computed. |
| Created at | The date and time when the replenishment proposal record was created. |
Process structure
A replenishment proposal may have multiple processes. A new process is created every time the proposal is computed (through a call to computeReplenishmentProposal mutation). A proposal’s process has the following structure:
| Field | Description |
|---|---|
| ID | The unique identifier of the process in SBS. |
| Status | The status of the replenishment proposal. Valid values: NEW - computation has not started yet, INPROCESS - computation is in progress, DONE - computation has completed without errors, ERROR - computation has completed with errors. |
| Errors | This fields reports errors that occurred during processing, if applicable. |
| Created at | The date and time when the process was created. |
| Click the icon to download the proposal’s result file to the local disk. | |
| Click the icon to open the analysis data charts in an external viewer. |
File structure
A replenishment proposal may have multiple input files. A proposal’s file has the following structure:
| Field | Description |
|---|---|
| ID | The unique identifier of the file in SBS. |
| File type | The type of data reported by the file. Valid values: CustomerOrders, SupplierOrders, Stock, Receptions, Deliveries. |
| Name | The file name. |
| Created at | The date and time when the file was created. |
| Click the icon to download the file to the local disk. |
Filter, search, and sort replenishment proposals
To filter tax replenishment proposals by the values displayed in the grid, click the Filter  icon on the respective column header in the grid. The colour of the Filter icon on each column header denotes whether the filter is active:
| Icon | Meaning |
|---|---|
|
Filter is not active |
 |
Filter is active |
To search replenishment proposals, type your search text in the Search text box available in the right-upper corner of the grid. You can use any field as search term (for example, the proposal ID).
To sort replenishment proposals, click the respective column of the grid. The arrow indicates the current sorting order.
Compute replenishment proposals
The high-level steps for computing a replenishment proposal are as follows:
- Obtain from your ERP/CRM or a similar software system the input CSV files to be used as input.
- Create a replenishment proposal.
- Add the input CSV files to the proposal.
- Compute the replenishment proposal.
- View the computation status and download the result files.
Step 1: Obtain the input CSV files from your ERP
A replenishment proposal will need several CSV files as input:
- MasterParameters.csv - This file enables analysis data charts to operate with human-readable product names and codes in addition to product IDs.
- CustomerOrders.csv
- SupplierOrders.csv
- Receptions.csv (required only if you select the Compute Analysis Data check box when creating the replenishment proposal)
- Deliveries.csv (required only if you select the Compute Analysis Data check box when creating the replenishment proposal)
- Stock.csv (required only if you select the Compute Analysis Data check box when creating the replenishment proposal).
The file names above are just an example; the actual file names may differ. Also note that you may provide multiple files of the same type as input. For example, you may use multiple CSV files of type “CustomerOrders”.
For the expected structure of each file, see Appendix 1: Input CSV Files.
Step 2: Create a replenishment proposal
To create a replenishment proposal:
-
If applicable, select an organization from the drop-down list.
-
In the replenishment proposals grid, click Add
 .
.
-
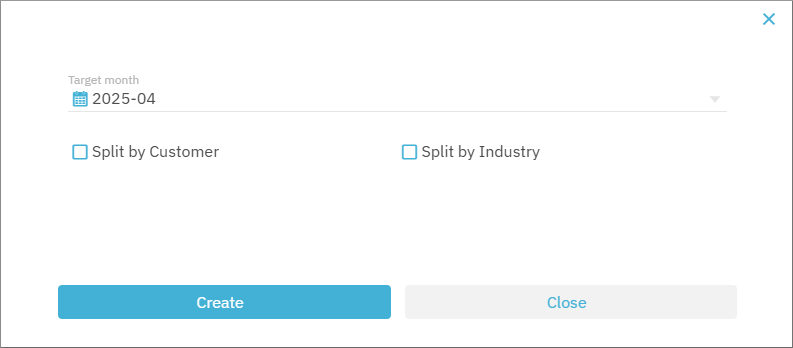
Select a target month. This is the only mandatory parameter. The available parameters are described in the table below.
| Parameter | Description |
|---|---|
| Target month | Mandatory. The month for which the replenishment proposal is computed. |
| Backdated target month | Optional. If provided, the replenishment proposal will compute data for every month starting with the backdated target month up to and including the target month. This is useful for simulating backdated calculations in order to compare them against real data. Setting this parameter is meaningful only if you set Compute Analysis Data also. Otherwise, it is ignored. |
| Demand coverage type | Optional. Specifies whether customers place orders only on business days or on any calendar day. Valid values: Business - orders are placed from Monday through Friday, excluding public holidays. Calendar - customer orders are placed on any calendar day. |
| Supplier orders interval | Optional. The average frequency, in calendar days, with which the distribution company places supplier orders. The default value is 10. |
| Months ahead smoothing | Optional. Months ahead to consider for smoothing the target month demand. If not provided, the default value is 3. |
| Lead time recency | Optional. Months of supply lead time history to consider. The default value is 6. |
| Supplier order reception days | Optional. Processing time for reception of supply order. The default value is 1. |
| Split by customer | Optional. If you select this check box, data in the result file will be grouped by customer. This option is mutually exclusive with Split by industry. |
| Split by industry | Optional. If you select this check box, data in the result file will be grouped by industry. This option is mutually exclusive with Split by customer. |
| Compute analysis data | Optional. If you select this check box, an additional result file will be generated, optimal_service_levels.csv, and the computation will produce analysis data that you can view as a chart.. |
| Impute missing sales | Optional. Enables you to adjust/impute sales data when demand is missing due to lack of inventory (e.g. online shop). If you select this option, it is mandatory to supply Stock.csv as input. |
- Click Create. A new dialog box pops up where you can add the input CSV files to the proposal.
Step 3: Add the input CSV files
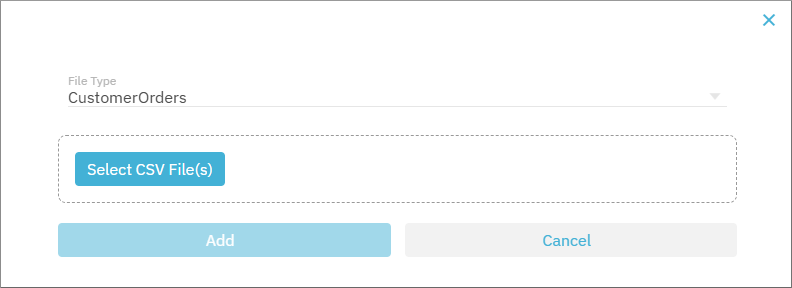
After you initiate a proposal, a dialog box pops up from where you can add the input CSV files to it.

To add input CSV files to a replenishment proposal:
-
Click Add
. -
In the dialog box that pops up, select a file type (for example “CustomerOrders”), and then click Select CSV Files(s) to add the respective file from your hard drive.
-
Click Add, and be patient while the file is uploading. The upload may take several seconds to several minutes, depending on the size of the input file, and your internet connection speed.
-
Repeat steps 1-3 for all files that should be added as input to the replenishment proposal.
Step 4: Compute the replenishment proposal
After you have added all files to the replenishment proposal, you can trigger the actual generation process.
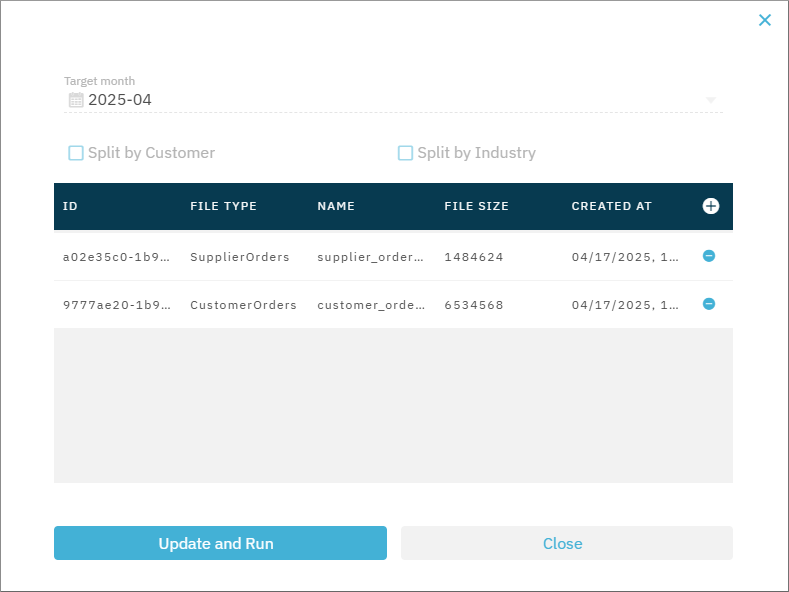
To compute the replenishment proposal, click Update and Run. The dialog box closes, and you can now track the replenishment proposal status from the Processes tab.
Step 5: View the replenishment proposal status and download the result file
Whenever you compute a replenishment proposal by clicking Update and Run, a new process is added to the replenishment proposal that reports its status. Note that, if you compute the same replenishment proposal multiple times, a new process will start for each run.
To view a replenishment proposal’s processes, click a replenishment proposal record in the upper grid. The lower grid should now be populated with that proposal’s processes, if any (in the “Processes” tab). The proposal’s input files can be viewed from the Files tab.
Initially, each process has the status NEW. After a short time (approx. 1 minute), the status changes to INPROCESS. This status will keep showing for as long as the proposal is being computed, which may take several minutes to several hours, depending on the size of the input files.
The Processes grid does not refresh automatically; click Refresh  to obtain the latest process status.
If validation or other errors are encountered during the computation, the process status changes to ERRORS and the actual errors are reported in the respective column.
If the replenishment proposal was computed successfully, the process status changes to DONE, and a CSV download icon becomes available in the Results column. Click the icon to download the generated file.
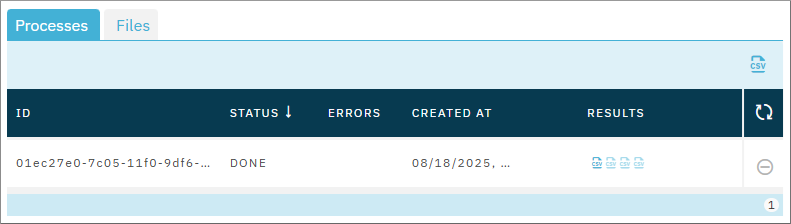
Depending on the input parameters provided at declaration creation, up to four CSV result files may be generated. Only files which are not grayed out are downloadable. To view information about each file (name and size), hover over the respective icon.
View analysis data
If you compute a replenishment proposal with the Compute Analysis Data option enabled, additional analysis data is generated that you can view as a chart. For such proposals, after computation, the process grid displays a URL icon  next to the generated output files, for example:
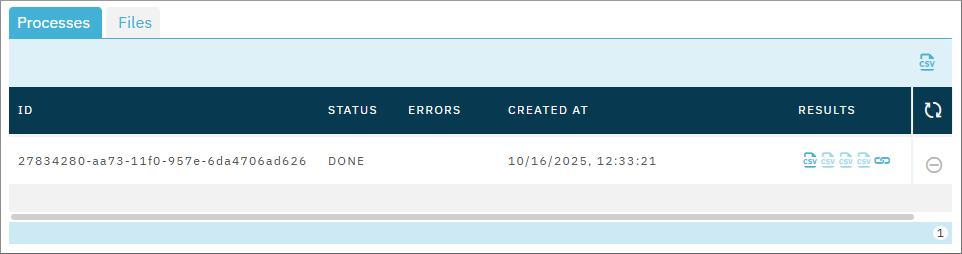
Click the URL icon to view the analysis data as a chart.
Delete replenishment proposals, files, processes
To delete a replenishment proposal, file, or process, click the Delete  icon next to the respective record in the grid.
GraphQL
For instructions about computing replenishment proposals through GraphQL API calls, see the API reference to the Predictive Inventory Management Service.